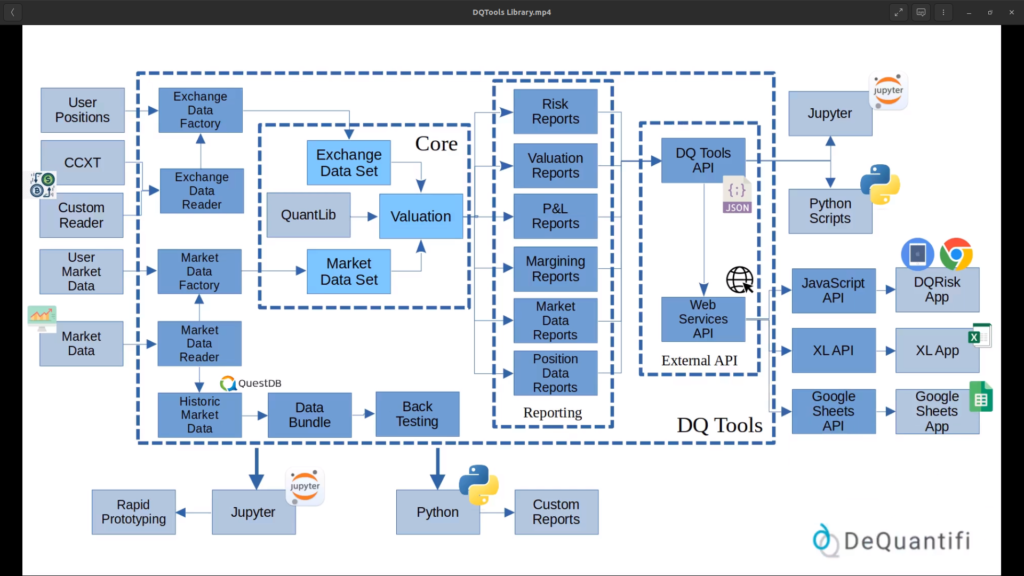
DQTools, our proprietary crypto software library, allows us to quickly build custom crypto-trading reporting solutions for our customers for items such as risk, P&L and margin. Using DQTools, we can build RAD solutions using spreadsheets or Python notebooks, as well as traditional n-tier solutions.
You can see examples of solutions that we have built using DQTools here
Our system for crypto options traders, DQRisk, was built using the DQTools library. It takes your positions across multiple crypto exchanges, and calculates the risk sensitivities and P&L on your aggregate positions. You can also use DQRisk to view the impact of different spot and vol scenarios, and its P&L Explain feature lets you analyse the performance of your trading strategies.
DQLabs is our incubator for new products that we are working on. Currently, DQLabs is researching how to use machine learning to improve crypto option pricing and to provide better risk reporting.